Market Outlook
August 29, 2016
Market Cues
Domestic Indices
Chg (%)
(Pts)
(Close)
Indian markets are likely to open flat with negative bias tracking SGX Nifty.
BSE Sensex
(0.2)
(54)
27,782
Nifty
(0.2)
(20)
8,573
US stocks ended modestly lower after volatile session on Friday, having bounced
Mid Cap
0.2
22
13,000
between gains and losses as investors wrestled with likely timing of US rate hike
Small Cap
(0.1)
(15)
12,487
following comments from top Fed officials. S&P 500 rose after Fed Chair Janet
Yellen said case for raising rates had strengthened but did not indicate when Fed
Bankex
(0.6)
(131)
22,006
would act. Yellen told that US economy was nearing central bank's goals of
maximum employment and price stability but that future hikes should be "gradual".
Global Indices
Chg (%)
(Pts)
(Close)
Stocks later traded lower after hawkish comments from Fed Vice Chair Stanley
Dow Jones
(0.3)
(53)
18,395
Fischer raised possibility of rate hike as soon as next month.
Nasdaq
0.1
7
5,219
FTSE 100 closed up following bout of volatility as traders digested Fed boss Yellen's
FTSE
0.3
21
6,838
remarks on future US rate moves. London-listed miners, Rio Tinto and Glencore
Nikkei
(1.2)
(195)
16,361
rebounded following poor performance in recent sessions. Restaurant Group was
Hang Seng
0.4
95
22,910
among biggest risers on the FTSE 250, despite reporting loss for the first half of year
as it announced that it would shut 33 under-performing sites.
Shanghai Com
0.1
2
3,070
Indian Markets fell on the first session of new F&O series on Friday with Sensex
Advances / Declines
BSE
NSE
down 54pts, as investors chose to stay on the sidelines ahead of speech by US Fed
Chair Janet Yellen. Both the indices posted second straight weekly losses.
Advances
1,056
577
Declines
1,603
1,019
News Analysis
Unchanged
207
80
L&T looks to turn asset-light, eyes `2tn revenues by FY2021E
Detailed analysis on Pg2
Volumes (` Cr)
Investor’s Ready Reckoner
BSE
2,799
Key Domestic & Global Indicators
NSE
17,711
Stock Watch: Latest investment recommendations on 150+ stocks
Refer Pg5 onwards
Net Inflows (` Cr)
Net
Mtd
Ytd
FII
(305)
7,613
38,495
Top Picks
CMP
Target
Upside
MFs
453
752
9,540
Company
Sector
Rating
(`)
(`)
(%)
Amara Raja
Auto/Auto Ancillary
Buy
902
1,076
19.3
Top Gainers
Price (`)
Chg (%)
HCL Tech
IT
Buy
779
1,000
28.4
Gruh
345
9.3
HDFC Bank
Financials
Accumulate
1,258
1,350
7.3
Centurytex
710
5.9
Bharat Electronics
Capital Goods
Buy
1,219
1,414
16.0
Equitas Holdings
Financials
Buy
180
235
30.7
Cox&Kings
192
5.9
Navkar Corporation Others
Buy
197
265
34.8
Icra
3,802
5.8
More Top Picks on Pg4
Carerating
1,254
5.3
Key Upcoming Events
Previous
Consensus
Top Losers
Price (`)
Chg (%)
Date
Region
Event Description
Reading
Expectations
Pel
1,851
(5.4)
Aug 30 Germany
Unemployment change (000's)
(7.00)
Jpinfratec
9
(4.8)
Aug 30 Euro Zone
Euro-Zone Consumer Confidence
(8.50)
Idbi
71
(4.0)
Aug 31 US
Consumer Confidence
97.30
96.65
Punjlloyd
21
(3.9)
Sep 01 Germany
PMI Manufacturing
53.60
Jpassociat
11
(3.6)
Sep 01 UK
PMI Manufacturing
48.20
6.(
As on August 26, 2016
More Events on Pg5
Market Outlook
August 29, 2016
News Analysis
L&T looks to turn asset-light, eyes `2tn revenues by FY2021E
Engineering major L&T's outgoing Chairman A.M.Naik has laid out 5-year road
map to become an "asset-light" entity with revenues of `2lakh cr by FY2021. L&T
has identified few non-core assets and is waiting for opportune moment to sell
them off, the chairman said while outlining his vision for a leaner L&T in times to
come.
Addressing shareholders at company's 71st Annual General Meeting, he said, "I
would like to take this opportunity to share my vision of L&T of tomorrow. Our
goal is to achieve revenue of `2tn by FY2021 without compromising on margins
and achieving an order inflow in excess of `2.5tn per annum." Naik, who is due to
retire on September 30, 2017, talked about the unfinished agenda, but his priority
is to make L&T asset light and restructure small businesses. "There is still so much
to be done, but one thing is asset light and putting in top gear all the restructuring
which is left of small businesses that are still part of L&T due to the bad world-wide
market. They have to be sold or tackled strategically," he told reporters after the
AGM. The company is restructuring its projects division- L&T IDPL and Naik hopes
this process to be completed by March next year.
"In General Insurance, we have sold the business and hope it will go out (from the
books) in next 10 days. We have already sold Kattupalli port project that was asset
heavy. Once we have finished restructuring the main ones, we will then look at
selling Nabha power project in Punjab," Naik said. For Nabha project, according
to Naik, the company will have to wait till the legal problems, claims and counter
claims are resolved and it might take more than a year to get settled. L&T is
reportedly in talks with the Adani group to sell the project at an estimated value of
around `3,000cr. Naik expressed confidence that with the economy starting to
turn around, this target is achievable provided right strategy and on-ground
execution is in place. As part of sharpening the business focus, Naik spoke of the
company identifying select growth businesses in L&T's broad portfolio. These
include IT, Technology Services, Defence, Smart world and Water Management.
"Our strategic plan involves re-allocation of resources- both talent and capital- to
businesses with visible value creation potential. As most of these are also asset-
light businesses, initiative will be in line with our larger objective of building asset-
light organisation."
We sense that strategic initiatives highlighted above are in the right direction and
good for long-term growth prospects of the company. As a result of divestment of
non-core assets, we expect L&T’s RoEs (at standalone level) to expand to 13.7% by
FY2018E. We continue to maintain BUY on the stock with price target of `1,700.
Market Outlook
August 29, 2016
Economic and Political News
Centre to set up fodder farms in districts
Maharashtra govt proposes subsidy for onion farmers
Kashmir's economy suffers body blow, `6,400cr loss in 49 days
Corporate News
Seed MNCs unite against GM rules
JSW Steel to set up 10mn tn a year capacity steel plant in Odisha
GMR wins bid to develop airport at Mopa
Quarterly Bloomberg Brokers Consensus Estimate
DLF Ltd Consol - Aug 29, 2016
Particulars (` cr)
1QFY17E
1QFY16
y-o-y (%)
4QFY16
q-o-q (%)
Net sales
2,219
2,231
(0.6)
2,336
(5.0)
EBITDA
840
827
1.5
874
(3.9)
EBITDA margin (%)
37.9
37.1
37.4
Net profit
134
122
10.2
132
1.2
Indian Oil Corp Ltd - Aug 29, 2016
Particulars (` cr)
1QFY17E
1QFY16
y-o-y (%)
4QFY16
q-o-q (%)
Net sales
94,037
1,01,009
(6.9)
80,019
17.5
EBITDA
8,960
10,101
(11.3)
4,044
121.5
EBITDA margin (%)
9.5
10.0
5.1
Net profit
4,214
6,436
(34.5)
1,243
239.0
Bharat Petroleum Corp Ltd - Sep 1, 2016
Particulars (` cr)
1QFY17E
1QFY16
y-o-y (%)
4QFY16
q-o-q (%)
Net sales
49,977
51,917
(3.7)
44,146
13.2
EBITDA
3,485
3,818
(8.7)
3,490
(0.1)
EBITDA margin (%)
7.0
7.4
7.9
Net profit
2,172
2,376
(8.6)
2,549
(14.8)
Market Outlook
August 29, 2016
Top Picks ★★★★★
Large Cap
Market Cap
CMP
Target
Upside
Company
Rationale
(` Cr)
(`)
(`)
(%)
To outpace battery industry growth due to better technological
Amara Raja Batteries
15,412
902
1,076
19.3
products leading to market share gains in both the automotive
OEM and replacement segments.
Uptick in defense capex by government, coupled with BELs
Bharat Electronics
29,261
1,219
1,414
16.0
strong market positioning, indicate good times ahead for BEL.
HCL Tech
109,870
779
1,000
28.4
Stock is trading at attractive valuations & factors all bad news.
Strong visibility for a robust 20% earnings trajectory, coupled
HDFC Bank
318,468
1,258
1,350
7.3
with high quality of earnings on account of high quality retail
business and strategic focus on highly rated corporates.
Back on the growth trend, expect a long term growth of 14% to
Infosys
234,461
1,021
1,370
34.2
be a US$20bn in FY2020.
Strong market positioning within the domestic AC markets to
Voltas
12,964
392
407
3.9
continue, EMP business set to revive
Source: Company, Angel Research
Mid Cap
Market Cap
CMP
Target
Upside
Company
Rationale
(` Cr)
(`)
(`)
(%)
Among the top 4 players in the consumer durables segment.
Bajaj Electricals
2,635
261
277
6.2
Improved profitability backed by turn around in E&P segment.
Strong order book lends earnings visibility.
Favourable outlook for the AC industry to augur well for
Cooling products business which is out pacing the market
Blue Star
4,675
490
527
7.5
growth. EMPPAC division's profitability to improve once
operating environment turns around.
Strong loan growth backed by diversified loan portfolio and
Equitas Holdings
6,030
180
235
30.7
adequate CAR. ROE & ROA likely to remain decent as risk of
dilution remains low. Attractive valuations considering growth.
Expectations of above average monsoon augurs well for
Goodyear India
1,245
540
631
16.9
Goodyear India as it derives ~50% of its turnover from farm
tyre segment.
Commencement of new projects, downtrend in the interest rate
IL&FS Transport
2,349
71
93
30.3
cycle, to lead to stock re-rating
Economic recovery to have favourable impact on advertising &
Jagran Prakashan
6,112
187
205
9.7
circulation revenue growth. Further, the acquisition of a radio business
(Radio City) would also boost the company`s revenue growth.
Speedier execution and speedier sales, strong revenue visibility
Mahindra Lifespace
1,774
432
522
20.7
in short-to-long run, attractive valuations
Massive capacity expansion along with rail advantage at ICD as
Navkar Corporation
2,803
197
265
34.8
well CFS augurs well for the company
Earnings boost on back of stable material prices and favourable
Radico Khaitan
1,271
96
125
30.9
pricing environment. Valuation discount to peers provides
additional comfort
Strong brands and distribution network would boost growth
Siyaram Silk Mills
1,258
1,342
1,347
0.4
going ahead. Stock currently trades at an inexpensive valuation.
Market leadership in Hindi news genre and no. 2 viewership
TV Today Network
1,801
302
363
20.2
ranking in English news genre, exit from the radio business, and
anticipated growth in ad spends by corporates to benefit the stock.
Source: Company, Angel Research
Market Outlook
August 29, 2016
Key Upcoming Events
Global economic events release calendar
Bloomberg Data
Date
Time
Country
Event Description
Unit
Period
Last Reported
Estimated
Aug 30, 2016
1:25 PM Germany
Unemployment change (000's)
Thousands
Aug
(7.00)
2:30 PM Euro Zone
Euro-Zone Consumer Confidence
Value
Aug F
(8.50)
Aug 31, 2016
7:30 PM
US
Consumer Confidence
S.A./ 1985=100
Aug
97.30
96.65
Sep 01, 2016
1:25 PM Germany
PMI Manufacturing
Value
Aug F
53.60
2:00 PM
UK
PMI Manufacturing
Value
Aug
48.20
6:30 AM
China
PMI Manufacturing
Value
Aug
49.90
50.00
Sep 02, 2016
6:00 PM
US
Change in Nonfarm payrolls
Thousands
Aug
255.00
180.00
6:00 PM
US
Unemployment rate
%
Aug
4.90
4.80
Sep 05, 2016
1:25 PM Germany
PMI Services
Value
Aug F
53.30
Sep 06, 2016
2:30 PM Euro Zone
Euro-Zone GDP s.a. (QoQ)
% Change
2Q F
0.30
Sep 07, 2016
2:00 PM
UK
Industrial Production (YoY)
% Change
Jul
1.60
Sep 08, 2016
China
Exports YoY%
% Change
Aug
(4.40)
India
Imports YoY%
% Change
Aug
(19.03)
Sep 09, 2016
India
Imports YoY%
% Change
Aug
(19.03)
7:00 AM
China
Consumer Price Index (YoY)
% Change
Aug
1.80
India
Exports YoY%
% Change
Aug
(6.84)
Sep 12, 2016
5:30 PM
India
Industrial Production YoY
% Change
Jul
2.10
Sep 13, 2016
2:00 PM
UK
CPI (YoY)
% Change
Aug
0.60
7:30 AM
China
Industrial Production (YoY)
% Change
Aug
6.00
Source: Bloomberg, Angel Research
Market Outlook
August 29, 2016
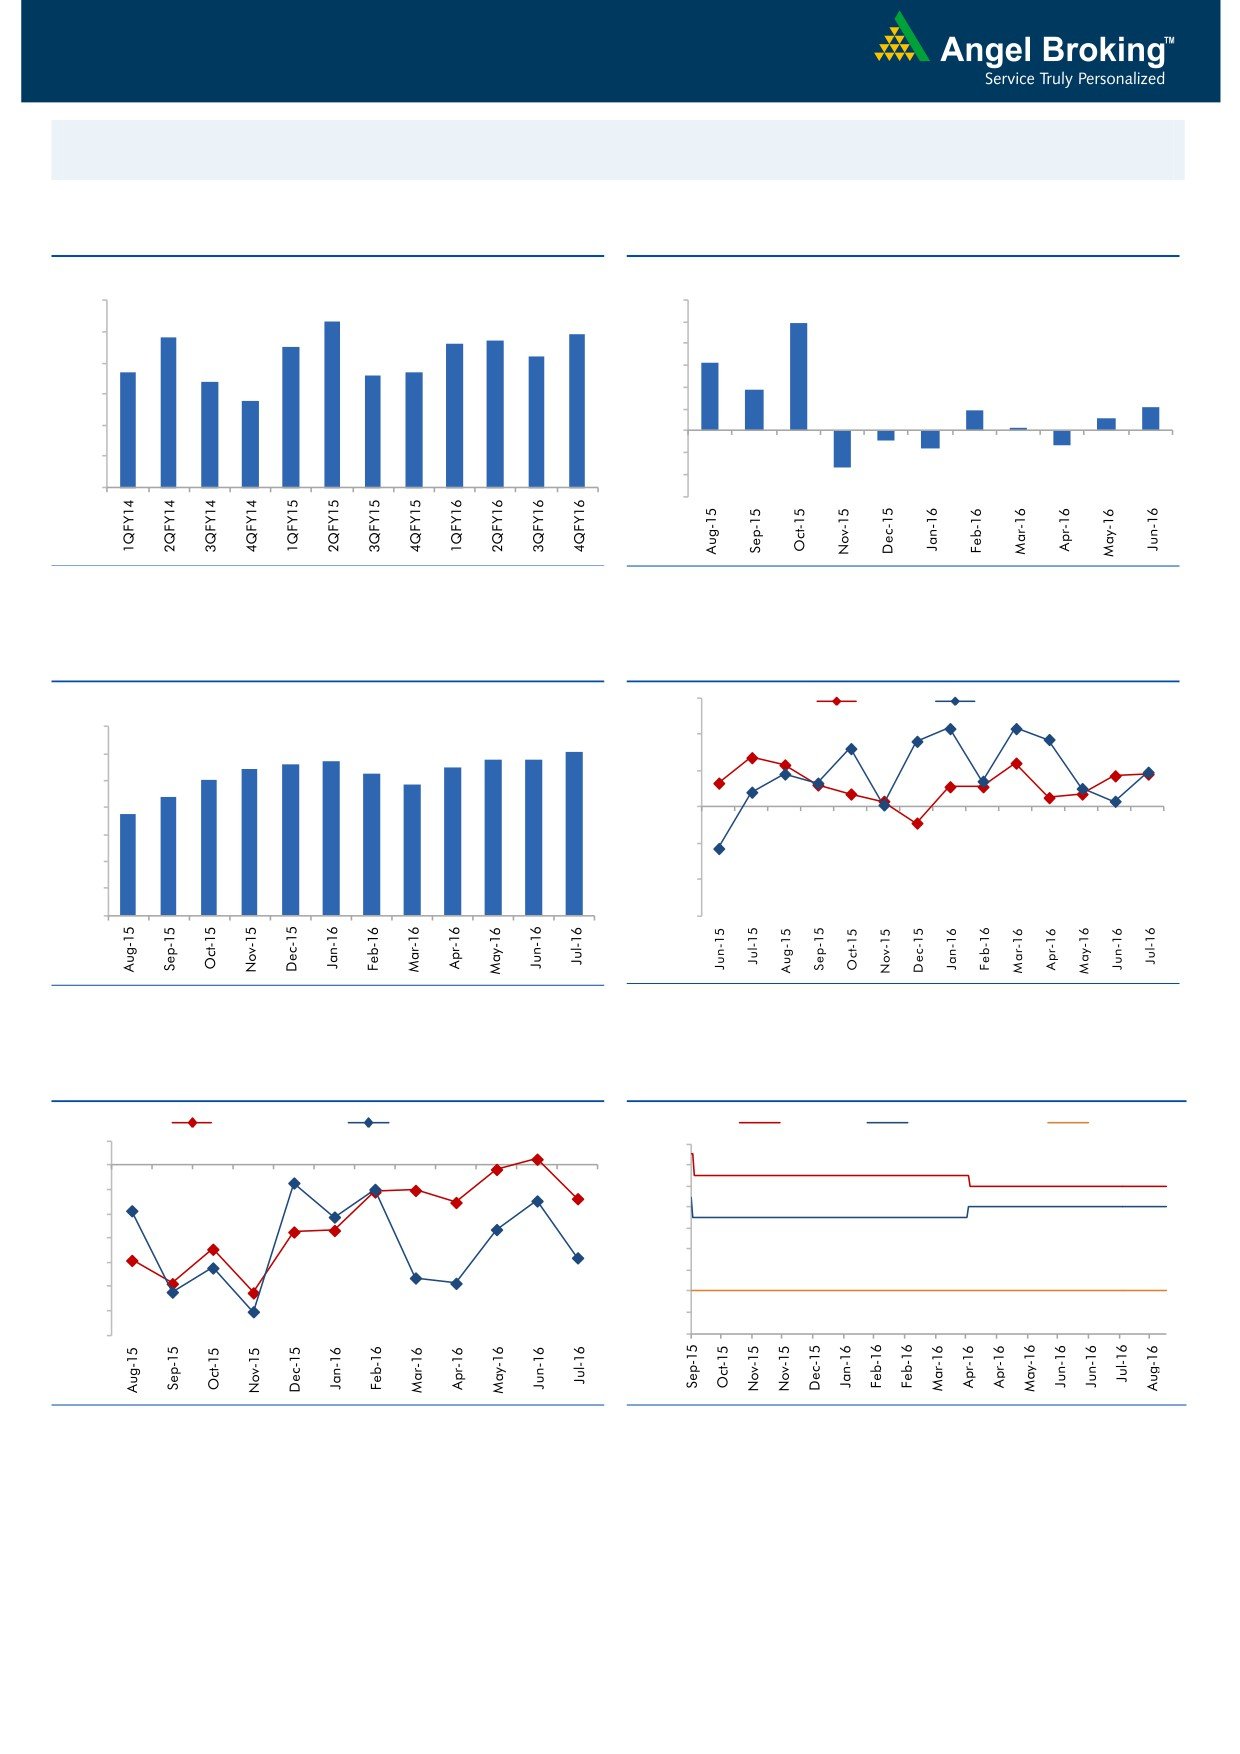
Macro watch
Exhibit 1: Quarterly GDP trends
Exhibit 2: IIP trends
(%)
(%)
9.0
8.3
12.0
9.9
7.8
7.7
7.9
10.0
8.0
7.5
7.6
7.2
8.0
6.3
6.7
6.6
6.7
7.0
6.4
6.0
3.7
5.8
4.0
2.1
6.0
1.9
1.1
2.0
0.3
5.0
-
4.0
(2.0)
(0.9)
(1.3)
(1.6)
(4.0)
3.0
(3.4)
(6.0)
Source: CSO, Angel Research
Source: MOSPI, Angel Research
Exhibit 3: Monthly CPI inflation trends
Exhibit 4: Manufacturing and services PMI
56.0
Mfg. PMI
Services PMI
(%)
7.0
6.1
54.0
5.6
5.7
5.8
5.8
5.4
5.5
6.0
5.3
5.0
4.8
52.0
5.0
4.4
3.7
4.0
50.0
3.0
48.0
2.0
46.0
1.0
-
44.0
Source: MOSPI, Angel Research
Source: Market, Angel Research; Note: Level above 50 indicates expansion
Exhibit 5: Exports and imports growth trends
Exhibit 6: Key policy rates
(%)
Exports yoy growth
Imports yoy growth
(%)
Repo rate
Reverse Repo rate
CRR
5.0
7.50
0.0
7.00
(5.0)
6.50
6.00
(10.0)
5.50
(15.0)
5.00
(20.0)
4.50
(25.0)
4.00
(30.0)
3.50
(35.0)
3.00
Source: Bloomberg, Angel Research
Source: RBI, Angel Research
Market Outlook
August 29, 2016
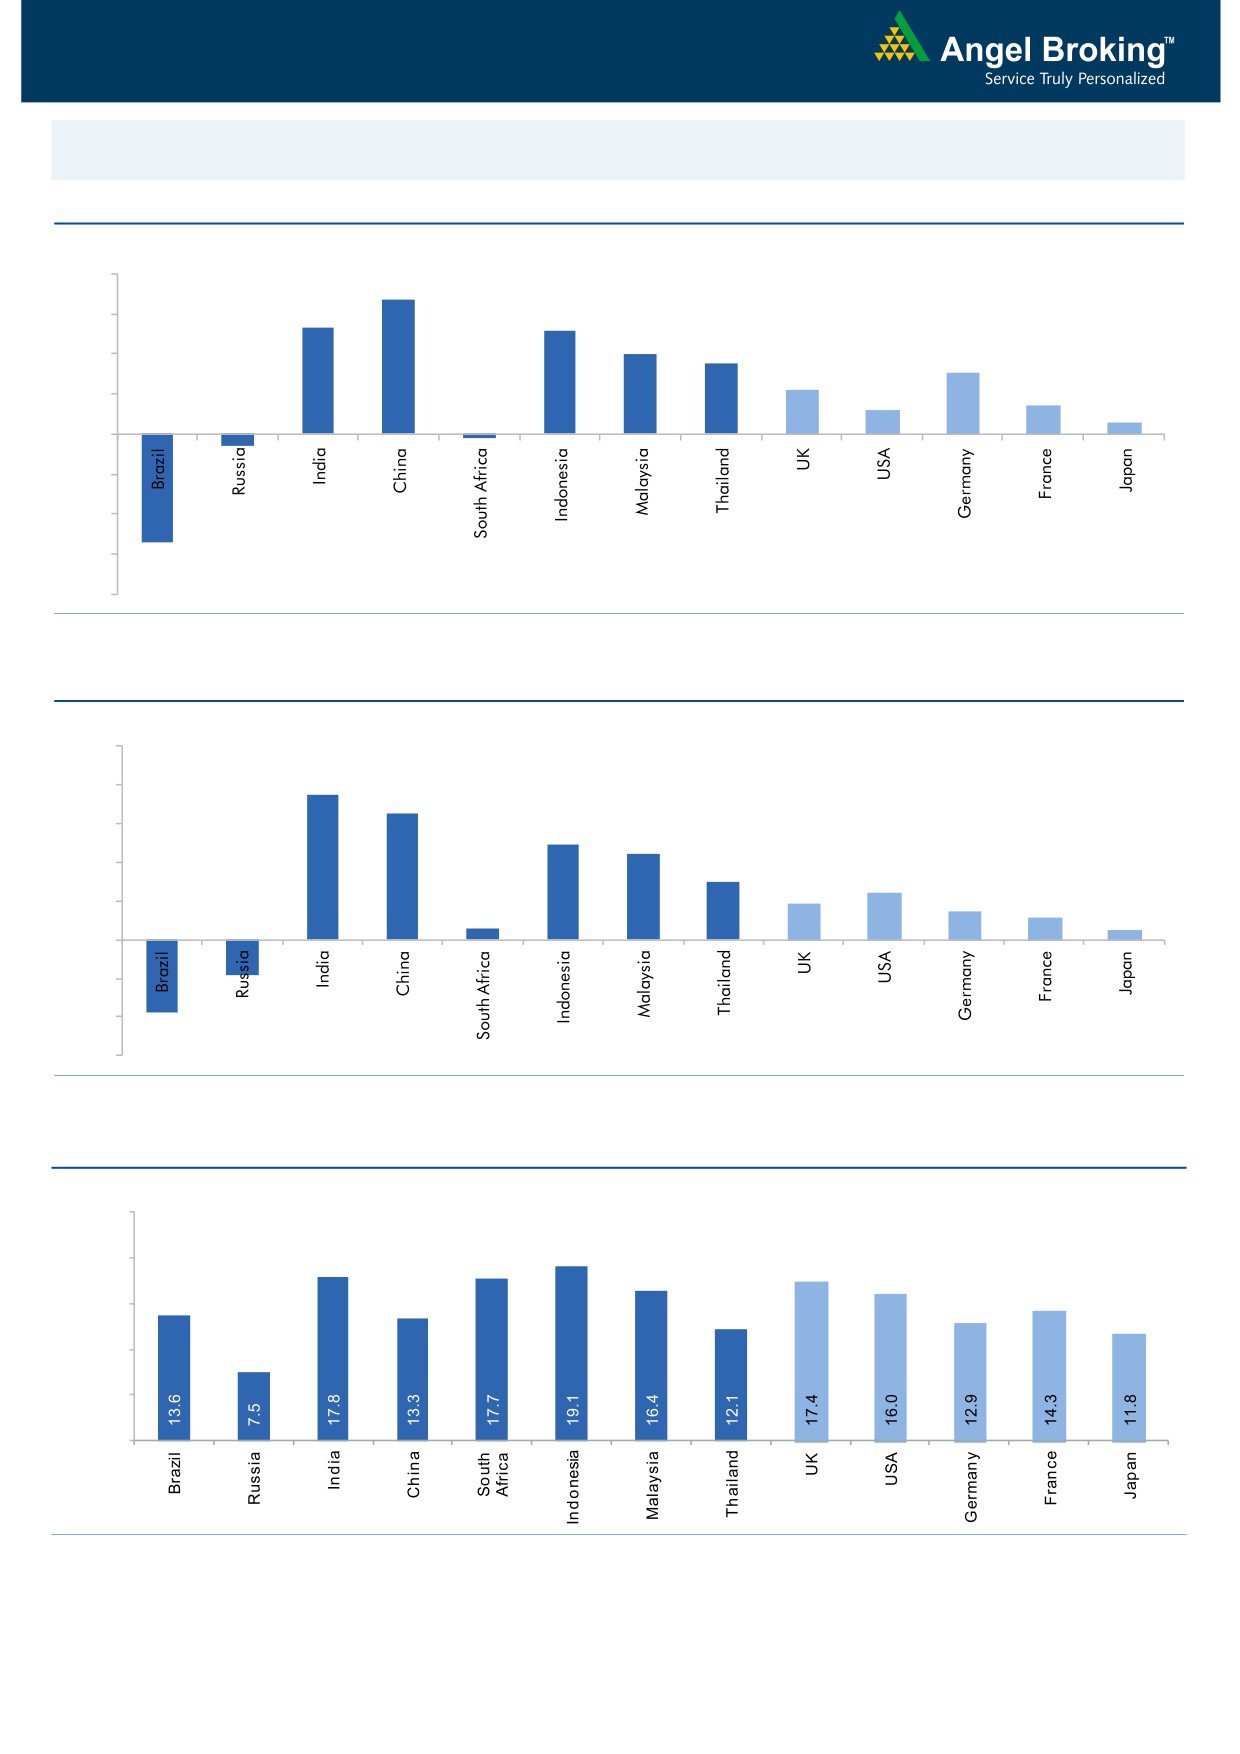
Global watch
Exhibit 1: Latest quarterly GDP Growth (%, yoy) across select developing and developed countries
(%)
8.0
6.7
6.0
5.3
5.2
4.0
3.5
4.0
3.1
2.2
2.0
1.2
1.4
0.6
-
(2.0)
(0.6)
(4.0)
(6.0)
(5.4)
(0.2)
(8.0)
Source: Bloomberg, Angel Research
Exhibit 2: 2016 GDP Growth projection by IMF (%, yoy) across select developing and developed countries
(%)
10.0
7.5
8.0
6.5
6.0
4.9
4.4
4.0
3.0
2.4
1.9
1.5
2.0
1.1
0.6
0.5
(3.8)
(1.8)
-
(2.0)
(4.0)
(6.0)
Source: IMF, Angel Research
Exhibit 3: One year forward P-E ratio across select developing and developed countries
(x)
25.0
20.0
15.0
10.0
5.0
-
Source: IMF, Angel Research
Market Outlook
August 29, 2016
Exhibit 4: Relative performance of indices across globe
Returns (%)
Country
Name of index
Closing price
1M
3M
1YR
Brazil
Bovespa
57,716
1.7
17.7
23.7
Russia
Micex
1,993
2.4
3.7
19.7
India
Nifty
8,573
(0.5)
8.3
1.5
China
Shanghai Composite
3,070
2.6
8.8
(18.1)
South Africa
Top 40
46,807
1.0
(0.6)
10.9
Mexico
Mexbol
47,370
1.7
3.5
9.9
Indonesia
LQ45
938
4.6
17.4
21.4
Malaysia
KLCI
1,683
1.2
3.2
6.4
Thailand
SET 50
987
2.5
11.5
6.4
USA
Dow Jones
18,395
(0.1)
3.3
10.8
UK
FTSE
6,838
1.3
9.0
12.9
Japan
Nikkei
16,361
(0.1)
(2.5)
(20.7)
Germany
DAX
10,588
2.8
2.4
2.6
France
CAC
4,442
0.3
(2.4)
(5.3)
Source: Bloomberg, Angel Research
Stock Watch
August 29, 2016
Company Name
Reco
CMP
Target
Mkt Cap
Sales ( Čcr )
OPM(%)
EPS (Č)
PER(x)
P/BV(x)
RoE(%)
EV/Sales(x)
(Č)
Price ( Č)
( Č cr )
FY17E FY18E
FY17E
FY18E
FY17E
FY18E
FY17E
FY18E
FY17E
FY18E
FY17E
FY18E
FY17E
FY18E
Agri / Agri Chemical
Rallis
Neutral
227
-
4,410
1,937
2,164
13.3
14.3
9.0
11.0
25.2
20.6
4.4
3.8
18.4
19.8
2.3
2.1
United Phosphorus
Accumulate
634
684
27,161
15,176
17,604
18.5
18.5
37.4
44.6
16.9
14.2
3.3
2.8
21.4
21.2
1.9
1.6
Auto & Auto Ancillary
Ashok Leyland
Buy
88
111
24,944
22,407
26,022
10.6
10.6
5.2
6.4
16.8
13.7
3.8
3.2
23.6
24.7
1.2
1.0
Bajaj Auto
Neutral
2,857
-
82,679
25,093
27,891
19.5
19.2
143.9
162.5
19.9
17.6
5.6
4.8
30.3
29.4
3.0
2.7
Bharat Forge
Neutral
859
-
19,995
7,726
8,713
20.5
21.2
35.3
42.7
24.3
20.1
4.5
4.1
18.9
20.1
2.6
2.3
Eicher Motors
Neutral
22,331
-
60,654
16,583
20,447
17.5
18.0
598.0
745.2
37.3
30.0
12.8
9.7
41.2
38.3
3.4
2.7
Gabriel India
Neutral
118
-
1,692
1,544
1,715
9.0
9.3
5.4
6.3
21.8
18.7
4.1
3.7
18.9
19.5
1.1
0.9
Hero Motocorp
Neutral
3,317
-
66,232
31,253
35,198
15.3
15.0
172.3
192.1
19.3
17.3
7.1
6.0
38.9
37.0
2.0
1.7
Jamna Auto Industries Neutral
217
-
1,731
1,486
1,620
9.8
9.9
15.0
17.2
14.4
12.6
3.2
2.7
21.8
21.3
1.2
1.1
L G Balakrishnan & Bros Neutral
457
-
718
1,302
1,432
11.6
11.9
43.7
53.0
10.5
8.6
1.5
1.3
13.8
14.2
0.6
0.6
Mahindra and Mahindra Neutral
1,424
-
88,447
46,534
53,077
11.6
11.7
67.3
78.1
21.2
18.2
3.4
3.0
15.4
15.8
1.9
1.6
Maruti
Neutral
4,921
-
148,645
69,186
82,217
14.7
14.4
198.5
241.4
24.8
20.4
4.8
3.9
20.2
20.0
1.9
1.5
Minda Industries
Neutral
1,234
-
1,959
2,728
3,042
9.0
9.1
68.2
86.2
18.1
14.3
4.1
3.3
23.8
24.3
0.8
0.7
Motherson Sumi
Neutral
322
-
42,619
45,896
53,687
7.8
8.3
13.0
16.1
24.7
20.0
8.0
6.4
34.7
35.4
1.0
0.8
Rane Brake Lining
Neutral
662
-
524
511
562
11.3
11.5
28.1
30.9
23.6
21.4
3.6
3.3
15.3
15.0
1.2
1.1
Setco Automotive
Neutral
46
-
609
741
837
13.0
13.0
15.2
17.0
3.0
2.7
0.5
0.5
15.8
16.3
1.2
1.1
Tata Motors
Neutral
504
-
145,414
300,209
338,549
8.9
8.4
42.7
54.3
11.8
9.3
1.9
1.6
15.6
17.2
0.6
0.5
TVS Motor
Accumulate
303
330
14,402
13,390
15,948
6.9
7.1
12.8
16.5
23.8
18.3
5.9
4.7
26.3
27.2
1.1
0.9
Amara Raja Batteries
Buy
902
1,076
15,412
5,717
6,733
18.7
18.9
38.4
48.9
23.5
18.5
5.9
4.8
25.3
24.8
2.5
2.0
Exide Industries
Neutral
175
-
14,841
7,439
8,307
15.0
15.0
8.1
9.3
21.6
18.8
3.0
2.7
14.3
16.7
1.6
1.5
Apollo Tyres
Accumulate
177
183
8,997
12,877
14,504
14.3
13.9
21.4
23.0
8.3
7.7
1.3
1.1
16.4
15.2
0.9
0.8
Ceat
Buy
866
1,119
3,504
7,524
8,624
13.0
12.7
131.1
144.3
6.6
6.0
1.2
1.0
19.8
18.6
0.5
0.5
JK Tyres
Neutral
123
-
2,780
7,455
8,056
15.0
15.0
21.8
24.5
5.6
5.0
1.2
1.0
22.8
21.3
0.5
0.4
Swaraj Engines
Neutral
1,126
-
1,398
660
810
15.2
16.4
54.5
72.8
20.7
15.5
6.4
5.8
31.5
39.2
1.9
1.6
Subros
Neutral
100
-
602
1,488
1,681
11.7
11.9
6.4
7.2
15.7
14.0
1.7
1.5
10.8
11.4
0.6
0.5
Indag Rubber
Neutral
172
-
451
286
326
19.8
16.8
11.7
13.3
14.7
12.9
2.5
2.3
17.8
17.1
1.2
1.1
Capital Goods
ACE
Neutral
42
-
419
709
814
4.1
4.6
1.4
2.1
30.3
20.2
1.3
1.2
4.4
6.0
0.8
0.7
BEML
Accumulate
1,057
1,157
4,403
3,451
4,055
6.3
9.2
31.4
57.9
33.7
18.3
2.0
1.8
6.3
10.9
1.4
1.2
Bharat Electronics
Buy
1,219
1,414
29,261
8,137
9,169
16.8
17.2
58.7
62.5
20.8
19.5
3.2
2.9
44.6
46.3
2.5
2.3
Stock Watch
August 29, 2016
Company Name
Reco
CMP
Target
Mkt Cap
Sales ( Čcr )
OPM(%)
EPS (Č)
PER(x)
P/BV(x)
RoE(%)
EV/Sales(x)
(Č)
Price ( Č)
( Č cr )
FY17E
FY18E
FY17E
FY18E
FY17E
FY18E
FY17E
FY18E
FY17E
FY18E
FY17E
FY18E
FY17E
FY18E
Capital Goods
Voltas
Accumulate
392
407
12,964
6,511
7,514
7.9
8.7
12.9
16.3
30.4
24.0
5.5
4.8
16.7
18.5
1.7
1.4
BGR Energy
Neutral
114
-
823
16,567
33,848
6.0
5.6
7.8
5.9
14.6
19.3
0.8
0.8
4.7
4.2
0.2
0.1
BHEL
Neutral
140
-
34,144
28,797
34,742
-
2.8
2.3
6.9
60.7
20.2
1.0
1.0
1.3
4.8
0.9
0.6
Blue Star
Accumulate
490
527
4,675
4,351
5,024
6.4
7.1
17.2
20.6
28.6
23.8
18.6
15.5
23.1
24.1
1.1
1.0
Crompton Greaves
Neutral
83
-
5,193
5,777
6,120
5.9
7.0
3.3
4.5
25.1
18.4
1.1
1.1
4.4
5.9
0.9
0.7
Greaves Cotton
Neutral
139
-
3,385
1,755
1,881
16.8
16.9
7.8
8.5
17.8
16.3
3.6
3.3
20.6
20.9
1.6
1.4
Inox Wind
Buy
189
286
4,191
5,605
6,267
15.7
16.4
24.8
30.0
7.6
6.3
2.1
1.6
25.9
24.4
0.8
0.7
KEC International
Neutral
137
-
3,521
9,294
10,186
7.9
8.1
9.9
11.9
13.8
11.5
2.0
1.8
15.6
16.3
0.6
0.6
Thermax
Neutral
833
-
9,931
5,421
5,940
7.3
7.3
25.7
30.2
32.4
27.6
3.9
3.6
12.2
13.1
1.7
1.6
VATech Wabag
Buy
564
681
3,077
3,136
3,845
8.9
9.1
26.0
35.9
21.7
15.7
2.7
2.3
13.4
15.9
0.9
0.7
Cement
ACC
Neutral
1,638
-
30,768
11,225
13,172
13.2
16.9
44.5
75.5
36.8
21.7
3.5
3.2
11.2
14.2
2.8
2.4
Ambuja Cements
Neutral
266
-
52,749
9,350
10,979
18.2
22.5
5.8
9.5
45.8
28.0
3.9
3.5
10.2
12.5
5.6
4.8
India Cements
Neutral
144
-
4,437
4,364
4,997
18.5
19.2
7.9
11.3
18.3
12.8
1.3
1.3
8.0
8.5
1.8
1.5
JK Cement
Neutral
780
-
5,453
4,398
5,173
15.5
17.5
31.2
55.5
25.0
14.1
3.0
2.6
12.0
15.5
1.8
1.5
J K Lakshmi Cement
Neutral
454
-
5,341
2,913
3,412
14.5
19.5
7.5
22.5
60.5
20.2
3.7
3.1
12.5
18.0
2.4
2.0
Orient Cement
Neutral
185
-
3,785
2,114
2,558
18.5
20.5
8.1
11.3
22.8
16.4
3.4
2.8
9.0
14.0
2.4
1.9
UltraTech Cement
Neutral
3,801
-
104,308
25,768
30,385
21.0
23.5
111.0
160.0
34.2
23.8
4.4
3.8
13.5
15.8
4.1
3.4
Construction
ITNL
Buy
71
93
2,349
8,946
10,017
31.0
31.6
8.1
9.1
8.8
7.9
0.3
0.3
4.2
5.0
3.6
3.3
KNR Constructions
Accumulate
702
802
1,975
1,385
1,673
14.7
14.0
41.2
48.5
17.0
14.5
3.2
2.7
14.9
15.2
1.5
1.3
Larsen & Toubro
Buy
1,428
1,700
133,077
67,665
77,249
10.7
11.5
57.3
71.2
24.9
20.1
2.3
2.1
12.6
14.3
2.2
1.9
Gujarat Pipavav Port
Neutral
170
-
8,235
705
788
52.2
51.7
5.0
5.6
34.1
30.4
3.4
3.0
11.2
11.2
11.4
9.7
MBL Infrastructures
Buy
114
285
472
2,797
3,405
14.7
15.4
21.0
34.8
5.4
3.3
0.6
0.5
11.0
16.2
0.8
0.8
Nagarjuna Const.
Neutral
83
-
4,620
8,842
9,775
9.1
8.8
5.3
6.4
15.7
13.0
1.2
1.1
8.2
9.1
0.7
0.6
PNC Infratech
Accumulate
121
129
3,116
2,350
2,904
13.4
13.7
48.0
42.0
2.5
2.9
0.5
0.4
16.8
13.2
1.4
1.2
Simplex Infra
Neutral
299
-
1,480
6,829
7,954
10.5
10.5
31.4
37.4
9.5
8.0
1.0
0.9
9.9
13.4
0.6
0.5
Power Mech Projects
Neutral
475
-
699
1,801
2,219
12.7
14.6
72.1
113.9
6.6
4.2
1.2
1.0
16.8
11.9
0.4
0.3
Sadbhav Engineering
Neutral
291
-
4,987
3,598
4,140
10.3
10.6
9.0
11.9
32.3
24.4
3.4
3.0
9.9
11.9
1.6
1.4
NBCC
Neutral
240
-
14,400
7,428
9,549
7.9
8.6
8.2
11.0
29.3
21.8
1.5
1.2
28.2
28.7
1.7
1.2
MEP Infra
Neutral
44
-
714
1,877
1,943
30.6
29.8
3.0
4.2
14.7
10.5
7.1
4.8
0.6
0.6
1.8
1.6
Stock Watch
August 29, 2016
Company Name
Reco
CMP
Target
Mkt Cap
Sales ( Čcr )
OPM(%)
EPS (Č)
PER(x)
P/BV(x)
RoE(%)
EV/Sales(x)
(Č)
Price ( Č)
( Č cr )
FY17E
FY18E
FY17E
FY18E
FY17E
FY18E
FY17E
FY18E
FY17E
FY18E
FY17E
FY18E
FY17E
FY18E
Construction
SIPL
Neutral
96
-
3,390
1,036
1,252
65.5
66.2
(8.4)
(5.6)
3.6
4.1
(22.8)
(15.9)
11.5
9.6
Engineers India
Neutral
264
-
8,895
1,725
1,935
16.0
19.1
11.4
13.9
23.2
19.0
3.2
3.1
13.4
15.3
4.0
3.6
Financials
Axis Bank
Neutral
587
-
140,055
58,081
66,459
3.5
3.5
32.4
44.6
18.1
13.1
2.4
2.1
13.6
16.5
-
-
Bank of Baroda
Neutral
158
-
36,509
19,980
23,178
1.8
1.8
11.5
17.3
13.8
9.2
1.6
1.3
8.3
10.1
-
-
Canara Bank
Neutral
269
-
14,582
15,225
16,836
1.8
1.8
14.5
28.0
18.5
9.6
1.3
1.0
5.8
8.5
-
-
Dewan Housing Finance Neutral
284
-
8,272
2,225
2,688
2.9
2.9
29.7
34.6
9.6
8.2
1.5
1.3
16.1
16.8
-
-
Equitas Holdings
Buy
180
235
6,030
939
1,281
11.7
11.5
5.8
8.2
31.0
21.9
2.7
2.4
10.9
11.5
-
-
Federal Bank
Neutral
67
-
11,435
9,353
10,623
2.9
2.9
4.4
5.8
15.1
11.5
1.5
1.3
9.5
11.0
-
-
HDFC
Neutral
1,367
-
216,110
11,475
13,450
3.4
3.4
45.3
52.5
30.2
26.0
5.8
5.1
20.2
20.5
-
-
HDFC Bank
Accumulate
1,258
1,350
318,468
46,097
55,433
4.5
4.5
58.4
68.0
21.5
18.5
3.8
3.2
18.8
18.6
-
-
ICICI Bank
Neutral
245
-
142,660
39,029
45,903
3.3
3.3
16.7
16.3
14.7
15.1
1.8
1.7
10.1
12.4
-
-
LIC Housing Finance
Neutral
578
-
29,159
3,712
4,293
2.6
2.5
39.0
46.0
14.8
12.6
2.8
2.4
19.9
20.1
-
-
Punjab Natl.Bank
Neutral
123
-
24,093
23,532
23,595
2.3
2.4
6.8
12.6
18.0
9.7
2.8
2.0
3.3
6.5
-
-
South Ind.Bank
Neutral
22
-
2,977
6,435
7,578
2.5
2.5
2.7
3.1
8.2
7.1
1.1
0.9
10.1
11.2
-
-
St Bk of India
Neutral
247
-
191,508
88,650
98,335
2.6
2.6
13.5
18.8
18.3
13.1
1.7
1.5
7.0
8.5
-
-
Union Bank
Neutral
134
-
9,205
13,450
14,925
2.3
2.3
25.5
34.5
5.3
3.9
0.8
0.7
7.5
10.2
-
-
Yes Bank
Neutral
1,326
-
55,835
8,978
11,281
3.3
3.4
74.0
90.0
17.9
14.7
3.4
2.9
17.0
17.2
-
-
FMCG
Asian Paints
Neutral
1,123
-
107,732
17,128
18,978
16.8
16.4
19.1
20.7
58.8
54.3
20.5
19.3
34.8
35.5
6.1
5.5
Britannia
Neutral
3,436
-
41,219
9,795
11,040
14.6
14.9
80.3
94.0
42.8
36.6
17.6
13.6
41.2
-
4.1
3.6
Colgate
Neutral
948
-
25,776
4,605
5,149
23.4
23.4
23.8
26.9
39.8
35.2
22.0
17.2
64.8
66.8
5.5
4.9
Dabur India
Neutral
289
-
50,804
8,315
9,405
19.8
20.7
8.1
9.2
35.7
31.4
9.9
8.2
31.6
31.0
5.8
5.1
GlaxoSmith Con*
Neutral
6,307
-
26,523
4,350
4,823
21.2
21.4
179.2
196.5
35.2
32.1
9.4
7.9
27.1
26.8
5.4
4.8
Godrej Consumer
Neutral
1,518
-
51,685
10,235
11,428
18.4
18.6
41.1
44.2
36.9
34.3
8.2
6.9
24.9
24.8
5.2
4.6
HUL
Neutral
903
-
195,345
35,252
38,495
17.6
17.4
20.4
21.9
44.2
41.2
36.3
31.8
82.2
77.3
5.4
4.9
ITC
Accumulate
254
283
306,297
40,059
44,439
39.0
39.2
9.1
10.1
27.9
25.1
7.6
6.7
27.2
26.5
7.1
6.4
Marico
Neutral
285
-
36,821
6,430
7,349
18.8
19.5
6.4
7.7
44.6
37.1
13.5
11.3
33.2
32.5
5.5
4.8
Nestle*
Neutral
6,822
-
65,770
10,073
11,807
20.7
21.5
124.8
154.2
54.7
44.2
22.4
20.2
34.8
36.7
6.4
5.4
Tata Global
Neutral
140
-
8,830
8,675
9,088
9.8
9.8
7.4
8.2
18.9
17.1
2.1
2.1
7.9
8.1
0.9
0.9
Procter & Gamble
Accumulate
6,760
7,369
21,942
2,939
3,342
23.2
23.0
146.2
163.7
46.2
41.3
103.5
99.3
25.3
23.5
7.0
6.1
Hygiene
Stock Watch
August 29, 2016
Company Name
Reco
CMP
Target
Mkt Cap
Sales ( Čcr )
OPM(%)
EPS (Č)
PER(x)
P/BV(x)
RoE(%)
EV/Sales(x)
(Č)
Price ( Č)
( Č cr )
FY17E FY18E
FY17E
FY18E
FY17E
FY18E
FY17E
FY18E
FY17E
FY18E
FY17E
FY18E
FY17E
FY18E
IT
HCL Tech^
Buy
779
1,000
109,870
49,242
57,168
20.5
20.5
55.7
64.1
14.0
12.2
2.8
2.2
20.3
17.9
2.2
1.7
Infosys
Buy
1,021
1,370
234,461
69,934
79,025
27.5
27.5
64.8
72.0
15.8
14.2
3.5
3.2
22.0
22.3
2.9
2.5
TCS
Buy
2,529
3,004
498,351
121,684
136,286
27.3
27.3
135.0
150.1
18.7
16.9
6.2
5.7
33.2
33.9
3.9
3.4
Tech Mahindra
Buy
460
700
44,613
30,347
33,685
17.0
17.0
37.5
41.3
12.3
11.1
2.7
2.3
21.8
20.7
1.2
1.0
Wipro
Buy
490
680
121,053
51,631
55,822
21.7
17.9
35.9
36.9
13.7
13.3
2.9
2.6
19.0
18.1
2.1
1.9
Media
D B Corp
Neutral
408
-
7,505
2,297
2,590
27.4
28.2
21.0
23.4
19.5
17.5
4.5
3.9
23.7
23.1
3.1
2.7
HT Media
Neutral
80
-
1,870
2,693
2,991
12.6
12.9
7.9
9.0
10.2
8.9
0.9
0.8
7.8
8.3
0.3
0.1
Jagran Prakashan
Accumulate
187
205
6,112
2,355
2,635
28.0
28.0
9.9
10.8
18.9
17.3
3.8
3.3
21.7
21.7
2.6
2.3
Sun TV Network
Neutral
469
-
18,471
2,850
3,265
70.1
71.0
26.2
30.4
17.9
15.4
4.6
4.0
24.3
25.6
6.1
5.2
Hindustan Media
Neutral
275
-
2,019
1,016
1,138
24.3
25.2
27.3
30.1
10.1
9.1
1.9
1.7
16.2
15.8
1.3
1.2
Ventures
TV Today Network
Buy
302
363
1,801
637
743
27.5
27.5
18.4
21.4
16.4
14.1
2.9
2.4
17.4
17.2
2.4
2.0
Metals & Mining
Coal India
Neutral
333
-
210,619
84,638
94,297
21.4
22.3
24.5
27.1
13.6
12.3
5.7
5.4
42.6
46.0
2.0
1.8
Hind. Zinc
Neutral
225
-
94,964
14,252
18,465
55.9
48.3
15.8
21.5
14.2
10.5
2.3
2.0
17.0
20.7
6.7
5.1
Hindalco
Neutral
155
-
32,028
107,899
112,095
7.4
8.2
9.2
13.0
16.9
11.9
0.8
0.8
4.8
6.6
0.8
0.8
JSW Steel
Neutral
1,754
-
42,388
53,201
58,779
16.1
16.2
130.6
153.7
13.4
11.4
1.8
1.6
14.0
14.4
1.6
1.3
NMDC
Neutral
106
-
41,907
6,643
7,284
44.4
47.7
7.1
7.7
14.9
13.7
1.3
1.3
8.8
9.2
4.2
3.8
SAIL
Neutral
48
-
19,824
47,528
53,738
(0.7)
2.1
(1.9)
2.6
18.5
0.5
0.5
(1.6)
3.9
1.3
1.2
Vedanta
Neutral
169
-
50,177
71,744
81,944
19.2
21.7
13.4
20.1
12.6
8.4
1.1
1.0
8.4
11.3
1.1
0.8
Tata Steel
Neutral
370
-
35,920
121,374
121,856
7.2
8.4
18.6
34.3
19.9
10.8
1.2
1.1
6.1
10.1
0.9
0.9
Oil & Gas
Cairn India
Neutral
201
-
37,591
9,127
10,632
4.3
20.6
8.8
11.7
22.8
17.1
0.7
0.7
3.3
4.2
5.6
4.6
GAIL
Neutral
379
-
48,101
56,220
65,198
9.3
10.1
27.1
33.3
14.0
11.4
1.3
1.2
9.3
10.7
1.0
0.9
ONGC
Neutral
238
-
204,006
137,222
152,563
15.0
21.8
19.5
24.1
12.2
9.9
1.1
1.0
8.5
10.1
1.8
1.6
Indian Oil Corp
Neutral
574
-
139,255
373,359
428,656
5.9
5.5
54.0
59.3
10.6
9.7
1.6
1.5
16.0
15.6
0.5
0.4
Reliance Industries
Neutral
1,028
-
333,226
301,963
358,039
12.1
12.6
87.7
101.7
11.7
10.1
1.2
1.1
10.7
11.3
1.6
1.3
Pharmaceuticals
Alembic Pharma
Neutral
633
-
11,936
3,483
4,083
20.2
21.4
24.3
30.4
26.1
20.8
5.9
4.7
25.5
25.3
3.4
2.8
Aurobindo Pharma
Accumulate
790
877
46,199
15,720
18,078
23.7
23.7
41.4
47.3
19.1
16.7
5.0
3.9
29.6
26.1
3.2
2.7
Aventis*
Neutral
4,334
-
9,982
2,357
2,692
17.3
17.3
153.5
169.2
28.2
25.6
4.8
3.9
25.8
28.4
3.9
3.2
Cadila Healthcare
Neutral
381
-
38,999
11,126
13,148
22.0
22.0
17.1
20.0
22.3
19.1
5.7
4.6
28.8
26.6
3.5
2.9
Cipla
Reduce
567
490
45,599
15,378
18,089
17.4
18.4
21.6
27.2
26.3
20.9
3.4
3.0
13.7
15.2
3.1
2.6
Stock Watch
August 29, 2016
Company Name
Reco
CMP
Target
Mkt Cap
Sales ( Čcr )
OPM(%)
EPS (Č)
PER(x)
P/BV(x)
RoE(%)
EV/Sales(x)
(Č)
Price ( Č)
( Č cr )
FY17E FY18E
FY17E
FY18E
FY17E
FY18E
FY17E
FY18E
FY17E
FY18E
FY17E
FY18E
FY17E
FY18E
Pharmaceuticals
Dr Reddy's
Neutral
3,040
-
51,843
16,043
18,119
23.1
24.7
126.0
157.8
24.1
19.3
3.6
3.1
15.7
17.1
3.2
2.8
Dishman Pharma
Sell
176
45
2,844
1,718
1,890
22.7
22.8
9.5
11.3
18.6
15.6
1.8
1.6
10.1
10.9
2.1
1.8
GSK Pharma*
Neutral
2,984
-
25,276
3,528
3,811
16.6
18.8
51.8
59.4
57.6
50.2
15.4
15.4
26.3
30.6
7.0
6.5
Indoco Remedies
Sell
310
225
2,857
1,112
1,289
18.2
18.2
13.2
15.6
23.5
19.9
4.2
3.5
19.2
19.2
2.8
2.4
Ipca labs
Accumulate
550
613
6,941
3,303
3,799
15.3
15.3
17.3
19.7
31.8
27.9
2.8
2.5
9.1
9.4
2.2
1.9
Lupin
Buy
1,512
1,809
68,178
15,912
18,644
26.4
26.7
58.1
69.3
26.0
21.8
5.1
4.2
21.4
20.9
4.4
3.6
Sun Pharma
Buy
756
944
181,946
31,129
35,258
30.0
30.9
28.0
32.8
27.0
23.1
4.1
3.4
18.7
18.9
5.5
4.7
Power
Tata Power
Neutral
76
-
20,488
36,916
39,557
17.4
27.1
5.1
6.3
14.9
12.0
1.3
1.2
9.0
10.3
1.6
1.4
NTPC
Neutral
158
-
130,278
86,605
95,545
17.5
20.8
11.8
13.4
13.4
11.8
1.4
1.3
10.5
11.1
2.9
2.8
Power Grid
Neutral
181
-
94,666
25,763
29,762
74.3
73.1
14.8
17.3
12.2
10.5
1.9
1.7
16.9
17.5
8.0
7.6
Real Estate
Prestige Estate
Buy
182
210
6,833
4,707
5,105
25.2
26.0
10.3
13.0
17.7
14.0
1.4
1.3
10.3
10.2
2.6
2.3
MLIFE
Buy
432
522
1,774
1,152
1,300
22.7
24.6
29.9
35.8
14.5
12.1
1.1
1.0
7.6
8.6
2.3
1.9
Telecom
Bharti Airtel
Neutral
344
-
137,551
105,086
114,808
34.5
34.7
12.2
16.4
28.2
21.0
1.9
1.8
6.8
8.4
2.2
1.9
Idea Cellular
Neutral
94
-
33,830
40,133
43,731
37.2
37.1
6.4
6.5
14.7
14.5
1.2
1.1
8.2
7.6
1.9
1.6
zOthers
Abbott India
Neutral
4,731
-
10,054
3,153
3,583
14.1
14.4
152.2
182.7
31.1
25.9
152.6
130.3
25.6
26.1
2.9
2.5
Bajaj Electricals
Accumulate
261
277
2,635
5,099
5,805
5.7
5.9
11.4
14.6
22.9
17.9
3.1
2.7
13.4
15.1
0.5
0.4
Finolex Cables
Neutral
429
-
6,556
2,883
3,115
12.0
12.1
14.2
18.6
30.2
23.1
16.1
14.0
15.8
14.6
2.0
1.8
Goodyear India*
Buy
540
631
1,245
1,598
1,704
10.4
10.2
49.4
52.6
10.9
10.3
50.5
44.3
18.2
17.0
0.5
62.2
Hitachi
Neutral
1,510
-
4,105
2,081
2,433
8.8
8.9
33.4
39.9
45.2
37.8
36.5
30.4
22.1
21.4
2.0
1.7
Jyothy Laboratories
Neutral
297
-
5,381
1,440
2,052
11.5
13.0
8.5
10.0
35.0
29.7
8.5
7.8
18.6
19.3
4.0
2.8
Page Industries
Neutral
14,812
-
16,521
2,450
3,124
20.1
17.6
299.0
310.0
49.5
47.8
329.9
251.8
47.1
87.5
6.5
5.2
Relaxo Footwears
Neutral
459
-
5,504
2,085
2,469
9.2
8.2
7.6
8.0
60.7
57.7
23.5
20.1
17.9
18.8
2.7
2.3
Siyaram Silk Mills
Accumulate
1,342
1,347
1,258
1,799
2,040
11.6
11.7
104.9
122.4
12.8
11.0
2.1
1.8
16.4
16.4
0.9
0.8
Styrolution ABS India*
Neutral
566
-
995
1,440
1,537
9.2
9.0
40.6
42.6
13.9
13.3
35.6
32.4
12.3
11.6
0.7
0.6
TVS Srichakra
Buy
2,511
2,932
1,923
2,304
2,614
13.7
13.8
231.1
266.6
10.9
9.4
282.1
222.2
33.9
29.3
0.8
0.7
HSIL
Neutral
358
-
2,589
2,384
2,515
15.8
16.3
15.3
19.4
23.4
18.5
23.3
20.0
7.8
9.3
1.3
1.2
Kirloskar Engines India
Neutral
277
-
4,009
2,554
2,800
9.9
10.0
10.5
12.1
26.4
22.9
11.0
10.4
10.7
11.7
1.2
1.1
Ltd
M M Forgings
Neutral
421
-
508
546
608
20.4
20.7
41.3
48.7
10.2
8.6
57.6
51.0
16.6
17.0
0.8
0.7
Banco Products (India)
Neutral
213
-
1,525
1,353
1,471
12.3
12.4
14.5
16.3
14.7
13.1
20.3
18.3
14.5
14.6
1.1
116.8
Stock Watch
August 29, 2016
Company Name
Reco
CMP
Target
Mkt Cap
Sales ( Čcr )
OPM(%)
EPS (Č)
PER(x)
P/BV(x)
RoE(%)
EV/Sales(x)
(Č)
Price ( Č)
( Č cr )
FY17E
FY18E
FY17E
FY18E
FY17E
FY18E
FY17E
FY18E
FY17E
FY18E
FY17E
FY18E
FY17E
FY18E
zOthers
Competent Automobiles Neutral
184
-
113
1,137
1,256
3.1
2.7
28.0
23.6
6.6
7.8
35.3
31.9
14.3
11.5
0.1
0.1
Nilkamal
Neutral
1,245
-
1,857
1,995
2,165
10.7
10.4
69.8
80.6
17.8
15.4
71.1
61.8
16.6
16.5
0.9
0.8
Visaka Industries
Neutral
159
-
253
1,051
1,138
10.3
10.4
21.0
23.1
7.6
6.9
20.4
19.1
9.0
9.2
0.5
0.5
Transport Corporation of
Neutral
195
-
1,494
2,671
2,911
8.5
8.8
13.9
15.7
14.1
12.5
1.9
1.7
13.7
13.8
1.2
1.1
India
Elecon Engineering
Accumulate
57
63
623
1,482
1,660
13.7
14.5
3.9
5.8
14.7
9.9
3.4
3.2
7.8
10.9
0.8
0.7
Surya Roshni
Accumulate
180
201
791
3,342
3,625
7.8
7.5
17.3
19.8
10.5
9.1
19.8
15.9
10.5
10.8
0.5
0.4
MT Educare
Neutral
141
-
560
366
417
17.7
18.2
9.4
10.8
15.0
13.0
3.3
2.9
22.2
22.3
1.5
1.3
Radico Khaitan
Buy
96
125
1,271
1,659
1,802
13.0
13.2
6.3
7.4
15.1
13.0
1.3
1.2
8.6
9.3
1.2
1.1
Garware Wall Ropes
Accumulate
491
524
1,075
873
938
12.9
13.1
30.9
34.9
15.9
14.1
2.5
2.2
15.7
15.2
1.2
1.1
Wonderla Holidays
Neutral
409
-
2,308
287
355
38.0
40.0
11.3
14.2
36.2
28.8
5.2
4.5
21.4
23.9
7.7
6.2
Linc Pen & Plastics
Neutral
276
-
408
382
420
9.3
9.5
13.5
15.7
20.5
17.6
3.5
3.0
17.1
17.3
1.2
1.0
The Byke Hospitality
Neutral
158
-
632
287
384
20.5
20.5
7.6
10.7
20.7
14.7
4.3
3.5
20.7
23.5
2.3
1.7
Interglobe Aviation
Neutral
857
-
30,875
21,122
26,005
14.5
27.6
110.7
132.1
7.7
6.5
46.3
33.1
168.5
201.1
1.5
1.2
Coffee Day Enterprises
Neutral
250
-
5,153
2,964
3,260
20.5
21.2
4.7
8.0
-
31.3
2.9
2.7
5.5
8.5
2.2
1.9
Ltd
Navneet Education
Neutral
105
-
2,493
1,062
1,147
24.0
24.0
6.1
6.6
17.2
15.8
3.5
3.1
20.6
19.8
2.4
2.3
Navkar Corporation
Buy
197
265
2,803
408
612
42.9
42.3
6.8
11.5
29.0
17.1
2.0
1.8
6.9
10.5
7.8
5.2
UFO Moviez
Neutral
483
-
1,332
619
685
33.2
33.4
30.0
34.9
16.1
13.8
2.2
1.9
13.8
13.9
1.9
1.5
VRL Logistics
Neutral
295
-
2,688
1,902
2,119
16.7
16.6
14.6
16.8
20.2
17.5
4.4
3.9
21.9
22.2
1.5
1.3
Team Lease Serv.
Neutral
1,110
-
1,898
3,229
4,001
1.5
1.8
22.8
32.8
48.8
33.8
5.2
4.5
10.7
13.4
0.5
0.4
S H Kelkar & Co.
Neutral
301
-
4,355
1,036
1,160
15.1
15.0
6.1
7.2
49.3
42.0
5.3
4.8
10.7
11.5
4.0
3.5
Quick Heal
Neutral
235
-
1,645
408
495
27.3
27.0
7.7
8.8
30.4
26.7
2.8
2.8
9.3
10.6
3.2
2.7
Narayana Hrudaya
Neutral
310
-
6,335
1,873
2,166
11.5
11.7
2.6
4.0
117.2
78.2
7.2
6.5
6.1
8.3
3.5
3.0
Manpasand Bever.
Neutral
733
-
3,669
836
1,087
19.6
19.4
16.9
23.8
43.4
30.8
5.2
4.6
12.0
14.8
4.1
3.1
Parag Milk Foods
Neutral
310
-
2,611
1,919
2,231
9.3
9.6
9.5
12.9
32.9
24.0
5.1
4.2
15.5
17.5
1.5
1.3
Source: Company, Angel Research; Note: *December year end; #September year end; &October year end; Price as on August 26, 2016
Market Outlook
August 29, 2016
Research Team Tel: 022 - 39357800
DISCLAIMER
Angel Broking Private Limited (hereinafter referred to as “Angel”) is a registered Member of National Stock Exchange of India
Limited,Bombay Stock Exchange Limited and Metropolitan Stock Exchange Limited. It is also registered as a Depository Participant with
CDSL and Portfolio Manager with SEBI. It also has registration with AMFI as a Mutual Fund Distributor. Angel Broking Private Limited is a
registered entity with SEBI for Research Analyst in terms of SEBI (Research Analyst) Regulations, 2014 vide registration number
INH000000164. Angel or its associates has not been debarred/ suspended by SEBI or any other regulatory authority for accessing
/dealing in securities Market. Angel or its associates/analyst has not received any compensation / managed or
co-managed public offering of securities of the company covered by Analyst during the past twelve months.
This document is solely for the personal information of the recipient, and must not be singularly used as the basis of any investment
decision. Nothing in this document should be construed as investment or financial advice. Each recipient of this document should make
such investigations as they deem necessary to arrive at an independent evaluation of an investment in the securities of the companies
referred to in this document (including the merits and risks involved), and should consult their own advisors to determine the merits and
risks of such an investment.
Reports based on technical and derivative analysis center on studying charts of a stock's price movement, outstanding positions and
trading volume, as opposed to focusing on a company's fundamentals and, as such, may not match with a report on a company's
fundamentals. Investors are advised to refer the Fundamental and Technical Research Reports available on our website to evaluate the
contrary view, if any.
The information in this document has been printed on the basis of publicly available information, internal data and other reliable
sources believed to be true, but we do not represent that it is accurate or complete and it should not be relied on as such, as this
document is for general guidance only. Angel Broking Pvt. Limited or any of its affiliates/ group companies shall not be in any way
responsible for any loss or damage that may arise to any person from any inadvertent error in the information contained in this report.
Angel Broking Pvt. Limited has not independently verified all the information contained within this document. Accordingly, we cannot
testify, nor make any representation or warranty, express or implied, to the accuracy, contents or data contained within this document.
While Angel Broking Pvt. Limited endeavors to update on a reasonable basis the information discussed in this material, there may be
regulatory, compliance, or other reasons that prevent us from doing so.
This document is being supplied to you solely for your information, and its contents, information or data may not be reproduced,
redistributed or passed on, directly or indirectly.
Neither Angel Broking Pvt. Limited, nor its directors, employees or affiliates shall be liable for any loss or damage that may arise from
or in connection with the use of this information.